
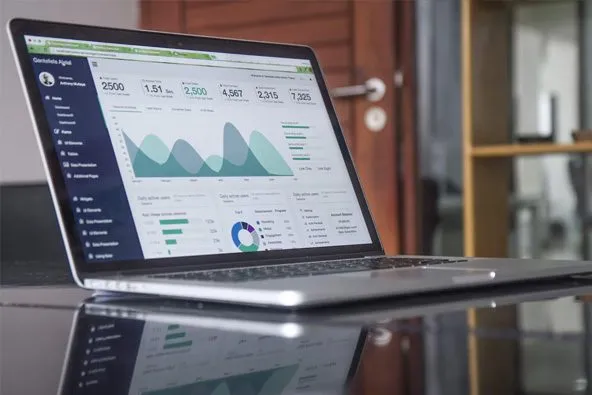
Team Performance Analysis Dashboard is used to provide visual representation of what target is set and what we have achieved. This will help to analyze individual team member’s performance.
Sales teams working in different regions Interactive charts allow the user to break out data by dimensions like department, program, gender and more. It also shows the performance of the members.
Loading Dashboard...
Enjoyed this perspective? Share it with your network:


Book a free consultation to talk through your unique needs. We’ll show you how our solutions can work for you.

